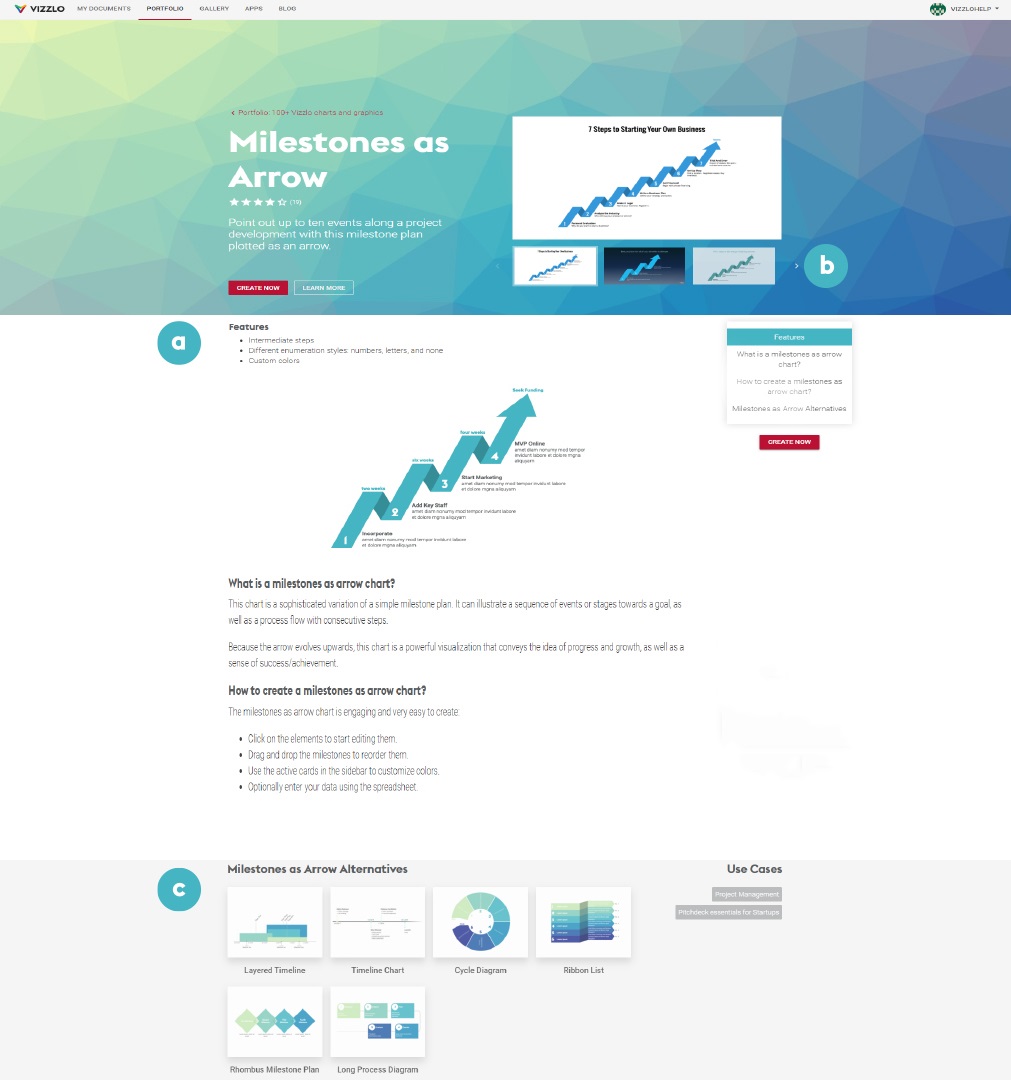
Every chart type of Vizzlo's Portfolio has a description (a) on its landing page.
This description is elucidative and explains the features of the vizzard (the chart maker), what is this specific chart and how it's used—this information might help you to identify if this visualization corresponds to your needs/expectations.
On the "How to" section of the description, you can learn the main steps to create your chart successfully. There, you will also get some insight about customizations features as well as setting options, and how to use them.
Some charts also present a "Resources" section, where you'll find links to specific tutorials or interesting blog posts related to these visualization types.

On this landing page, precisely on its right side (b), you also find different examples and uses of each visualization. They are there to help you to get inspired and to visualize how your chart can look in the end.
In addition to these examples, you also find suggestions of different vizzards that might suit your purposes (c).
Hover the mouse over the main chart illustration and click on the red button "Create Now" to get started!

Comments
0 comments
Article is closed for comments.