
Once you chose a chart, there are multiple ways to edit and add data to it. Depending on the use case it might be easier to:
- simply add or edit element right in the sidebar of a chart or
- upload data into a chart's spreadsheet.
Edit data in sidebar
Once you selected an element in your chart, e.g. bars, lines, milestones, ... you see a corresponding card in the sidebar. Changing an elements data or properties is straightforward
As you can see in the animation above, changing a color's hex code can be done in the card too. Click on the color drops to open a color picker. The auto toggle will reset a color back to its default, which is part of a chart's theme.
Whenever there is a wheel icon in the cards, just click on the icon and edit additional settings.
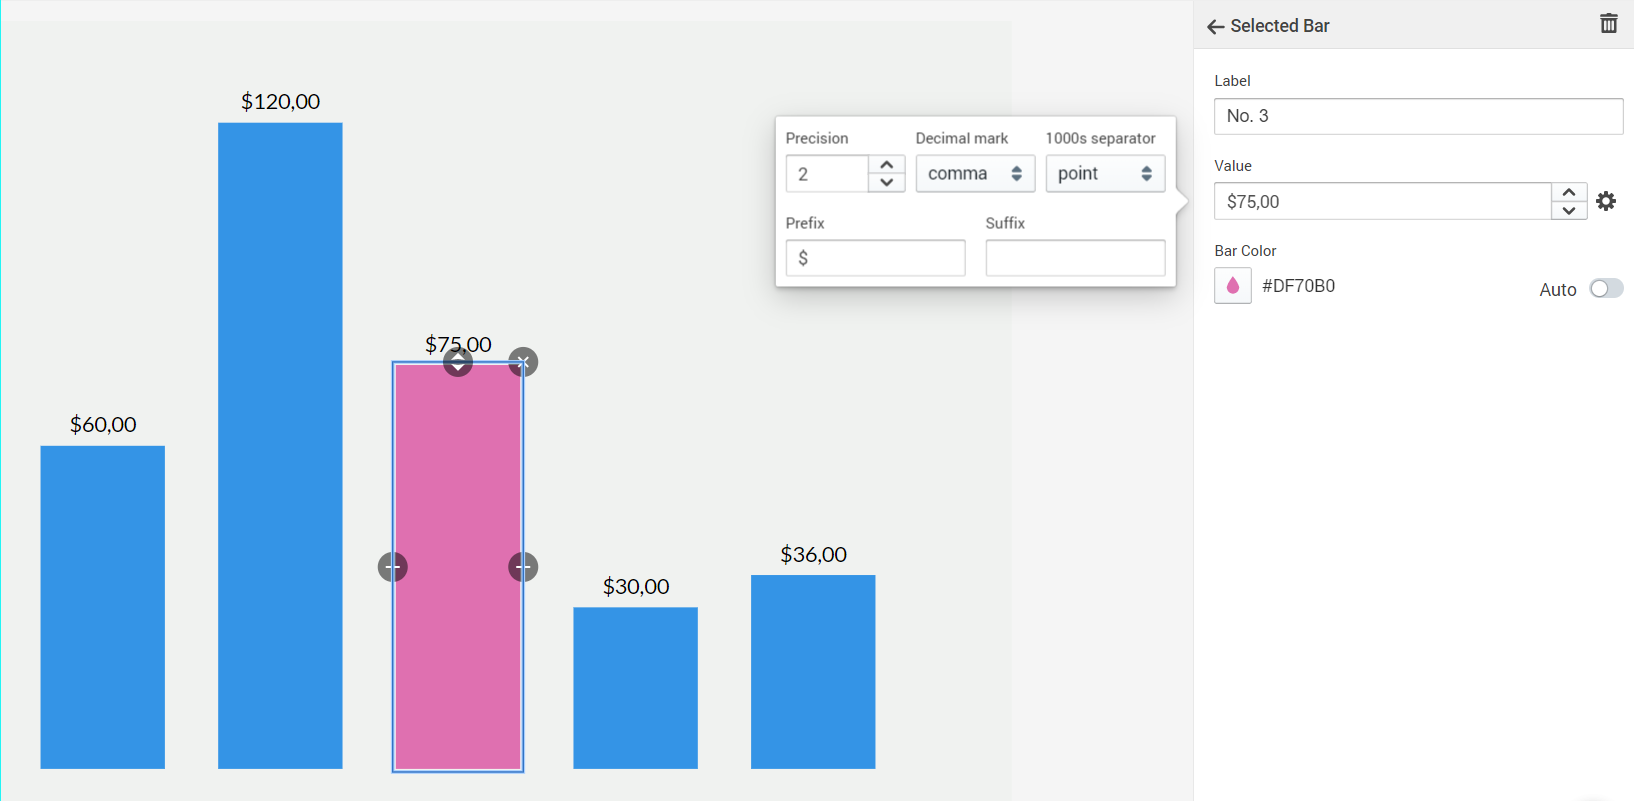
To add data you can click on the `+` either in the top right of the chart or, in case of a Bar chart, or on the left and right side of a bar. To delete an element, click in the `x`.
Spreadsheet
If you've already prepared your data as Excel file or .csv file you can easily drag and drop it directly into the chart's spreadsheet. Click on `Spreadsheet` on top of the chart and drag your file in the spreadsheet.
At the title of a column you can also edit the settings of your data clicking on the wheel icon.
Tip: right-click on the chart and on any element to see a context menu with further options.
Comments
0 comments
Article is closed for comments.