
The foundation of every chart you make with Vizzlo is your data. In this article we cover how your data needs to look like to be interpreted without problems. We are constantly working on making the process of uploading data as easy as possible.
Summary
To make sure that your data is imported correctly:
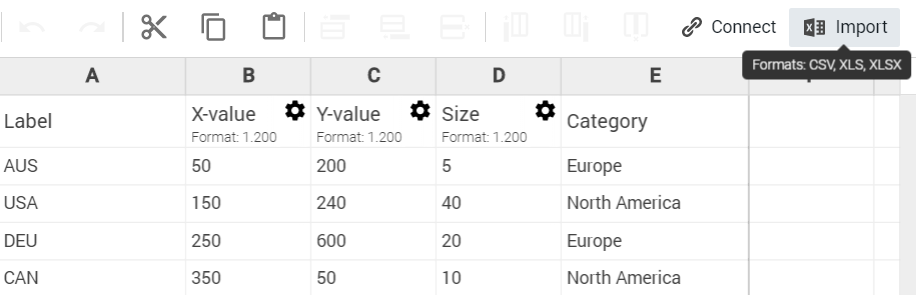
- Charts need a specific column order. This is the most essential point. Before you get your data into Vizzlo you have to make sure, that the columns of your data sheet are in the expected order. You can see the data when clicking on 'Spreadsheet' in the menu bar above your chart.
For this article we used a Bubble Chart; in which case the first and fifth columns contain strings, columns 2 to 4 numbers. - Numbers can come with pre- & suffixes - but you need to tell the spreadsheet. If your data contains numbers with pre- or suffixed currency signs, percentage signs etc., make sure to give that information to the spreadsheet before you upload it. Below we'll cover such a case.
- Blank rows are fine, comments and footnotes not. Spreadsheets commonly contain comments, and descriptions in the first rows, or footnote at the end. This content needs to be removed. Blank rows are fine, but they will be removed after closing the spreadsheet; just like, e.g. images that can be embedded in an Excel file.
- The first row of your data should be or will become column headers. By default, every chart comes with column headers. If your data doesn't have column headers you can simply use defaults and later edit if you like.
- Each cell should contain a single number, a string or date. Cells, containing a mixture of numbers and text, e.g. 'Stuttgart 21', will be interpreted as text. Unless you tell the spreadsheet to expect a prefix 'Stuttgart'.
Exceptions are dates, which can come in the form of "January 1, 2020" - see our article for supported date formats. - Data can contain empty cells. Empty cells will be highlighted in red. That is no problem for most chart types.
Once the data was uploaded, you can edit it in the spreadsheet or in the chart editor, see our article Editing and adding data.
We will show you 3 ways to import your data into Vizzlo:
- Copy & paste the data from a spreadsheet
- Import your data from an Excel file or CSV file
- Connect your chart to a Google Sheets file
1. Copy & Paste
In this article we use data from the Gapminder foundation as an example, which you can download here. The first 5 rows of this example data look like this:
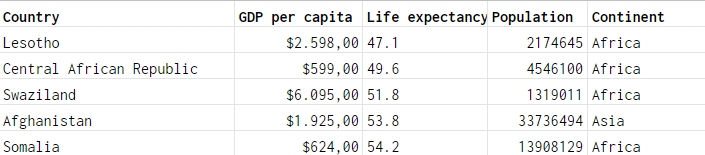
Simply copy your data using the shortcut 'Ctrl / Cmd ⌘ + C' (Windows/Mac) and then paste it into a chart's spreadsheet with 'Ctrl / Cmd ⌘ + P'. If you have selected your data you can also right-click and choose copy or paste.
First try
Something went wrong. The spreadsheet in the chart expects a different data format for column B; the red cells indicating a wrong data format. Also, the data in column 'Life expectancy' is not the same as in the Excel file because the expected decimal separator was ',' whereas in the Excel file we used a '.'.
NOTE: the decimal and 1000s separator might be different depending on your locale.
So there are three issues we need to take care of:
- the prefixed '$' in the column 'GDP per capita'
- the decimal separator is a '.' for column 'Life expectancy'
- change precision of column 'Life expectancy' (optional)
Second try
Hurray! 🎉
2. Upload Excel files or .csv files
Now that you know what to consider when adding data to Vizzlo, uploading a .xslx, .xls, or .csv is straightforward. You have two options: drag and drop the file into the spreadsheet ...
... or click on 'Import' to browse your local files.
3. Connect your chart to Google Sheets
In order to get your data from a Google Sheet, you need to click on 'Connect' next to 'Import'. This will open the following dialog:
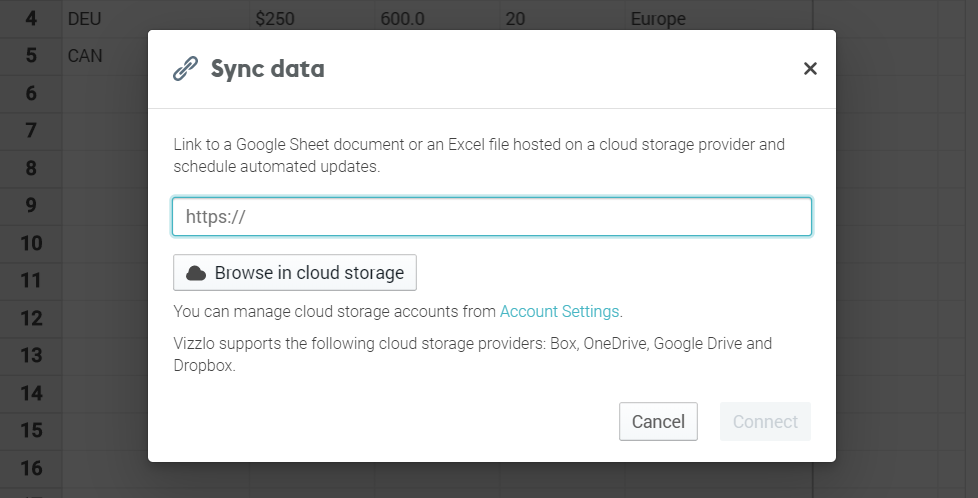
- Paste a link to a public Google Sheet (or Excel file)
- Browse your files hosted in the cloud if you did connect your Vizzlo account to a cloud storage before
This feature allows you not only a one-time upload of a Google Sheet document or Excel file, but also to schedule automatic updates of your document.
Comments
0 comments
Article is closed for comments.