
Vizzlo Charts and Business Graphics is a practical add-on for Google Slides, made to increase your productivity and enhance your presentations.
- Insert any existing charts from vizzlo.com/documents in a Google Slides presentation
- Create new charts
- Update all charts in your slides with a single click
Getting started with Vizzlo for Google Slides
Installation
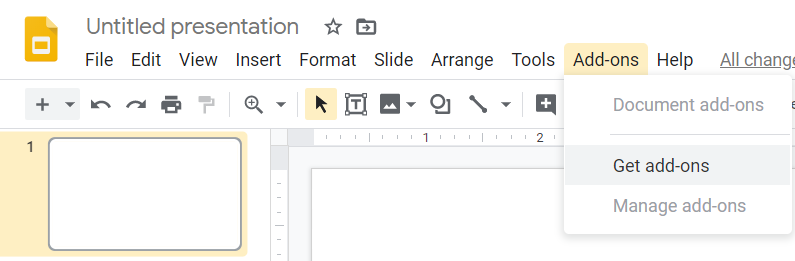
Install the add-on from the G Suite Marketplace. In an open Google Slides presentation you can also click on Add-ons —> Get add-ons and search for 'Vizzlo'.
Known issue
Once you have installed the add-on there is not much you can do with it except contacting the help center. You need to refresh the page first. We have reported this bug to Google. Once you connected the add-on with your Vizzlo account, you will be able to use all its features according to your subscription plan.
If you used Vizzlo on our website before you'll find all your documents in the sidebar.
Insert a document into your presentation
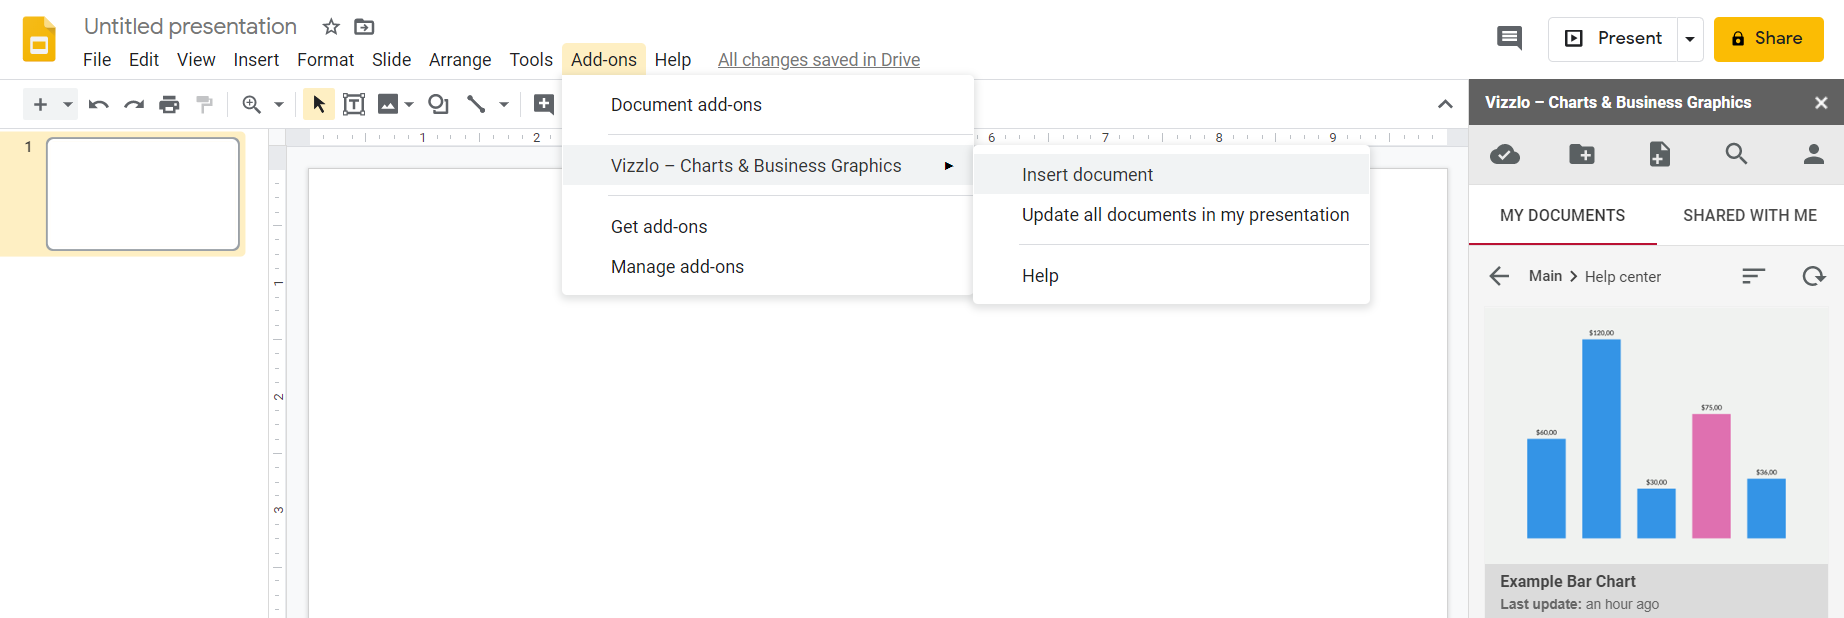
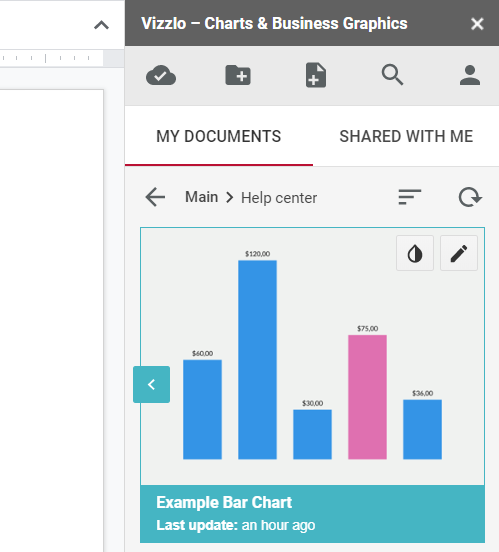
Click on any document to select it. Click on the left arrow to insert it into the presentation.
Edit a chart and update your presentation
Click on the pencil icon in the top right corner of a chart preview - you will be navigated to our editor at vizzlo.com. When you updated your charts click on the cloud icon to update your slides too. A menu will open and show you which charts were updated in your slides deck.
Create a new document
Click on the "New document" icon on the top of the sidebar. You will be directed to vizzlo.com/graphs where you can choose a chart from our portfolio.
Summary
Follow these steps to get Vizzlo add-on for Google Slides:
- Install the add-on from the G Suite Marketplace or click on in on open presentation click on Add-ons —> Get add-ons and search for Vizzlo
- Click on Add-ons —> Vizzlo Charts & Business Graphics —> Insert a document to initialize the sidebar
- Connect the sidebar with your account. Now you'll be able to navigate through all your Vizzlo documents
Comments
0 comments
Article is closed for comments.