
Vizzlo's Simple Gantt chart is an easy-to-use chart to manage your project timelines effectively without much effort.
What is a Simple Gantt chart?
A Simple Gantt chart is Vizzlo's 'lightweight alternative' of a Gantt Chart. As the name suggests, it has fewer customization options but is therefore easier to use and quicker to create. A Simple Gantt will help you to organize and communicate your projects.
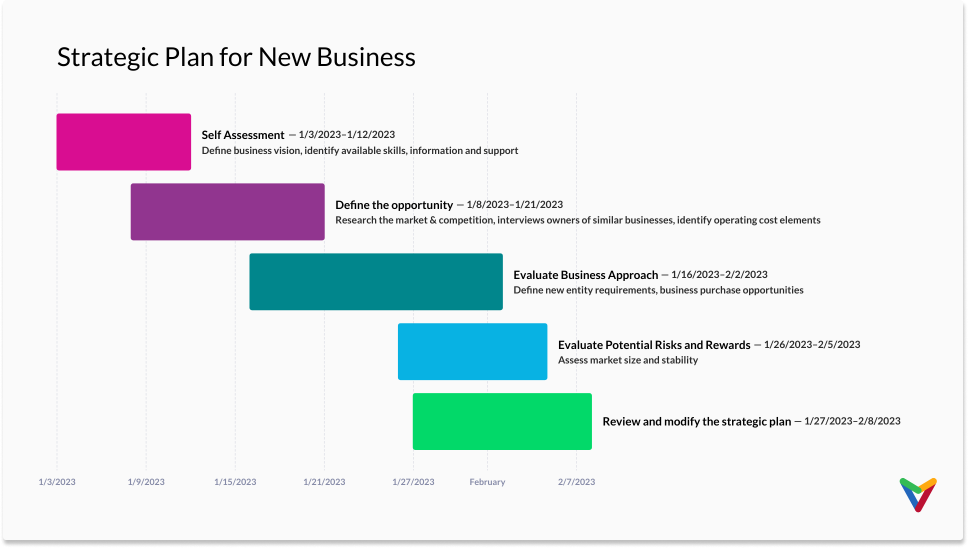
On the y-axis you list the tasks that together make up your project. Tasks are represented by floating bars. The position and length of each bar visualize the start date, duration, and the end date of a task. Time is represented on the x-axis.
Add and edit data
The data structure of this chart looks as follows:
| Task | Description | Start date | End date |
| Task 1 | description 1 | 2019/12/19 | 2020/01/30 |
| Task 2 | description 2 | 2020/01/2 | 2020/02/22 |
| ... |
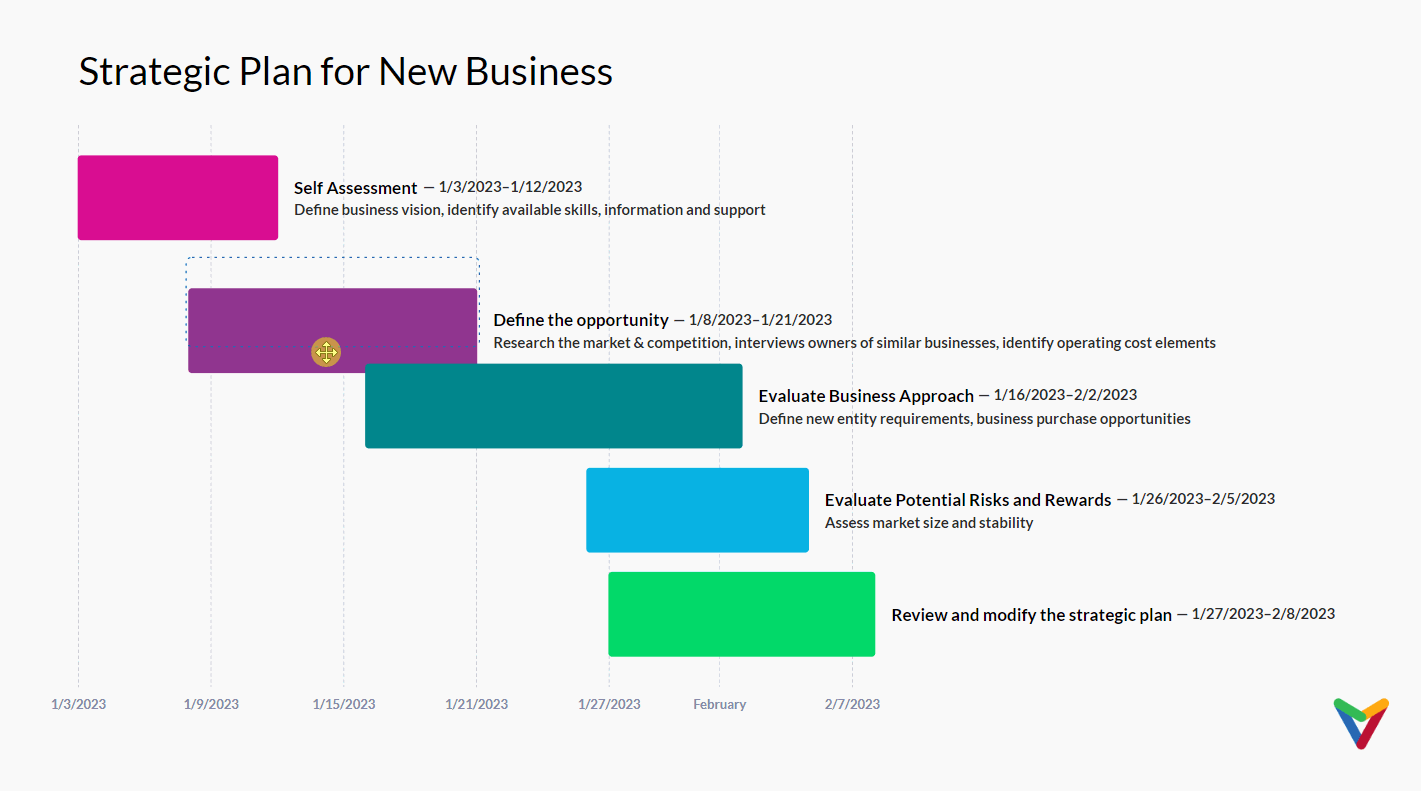
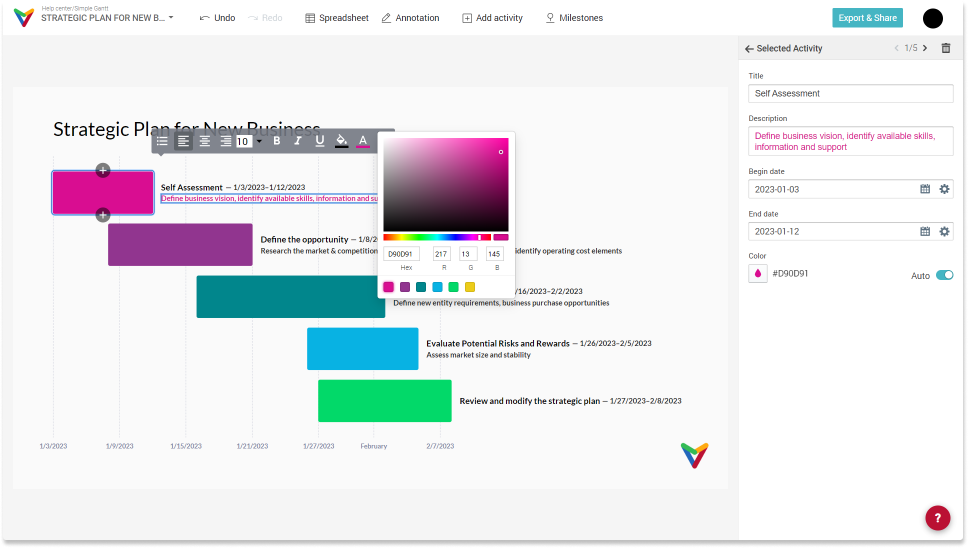
The chart is completely interactive. To edit the default data, click on any segment and start editing it. The segments can be dragged left and right, making it easy to adjust the time span. Segments can also be dragged vertically to save time for you, in case a plan changes.
Show or hide content
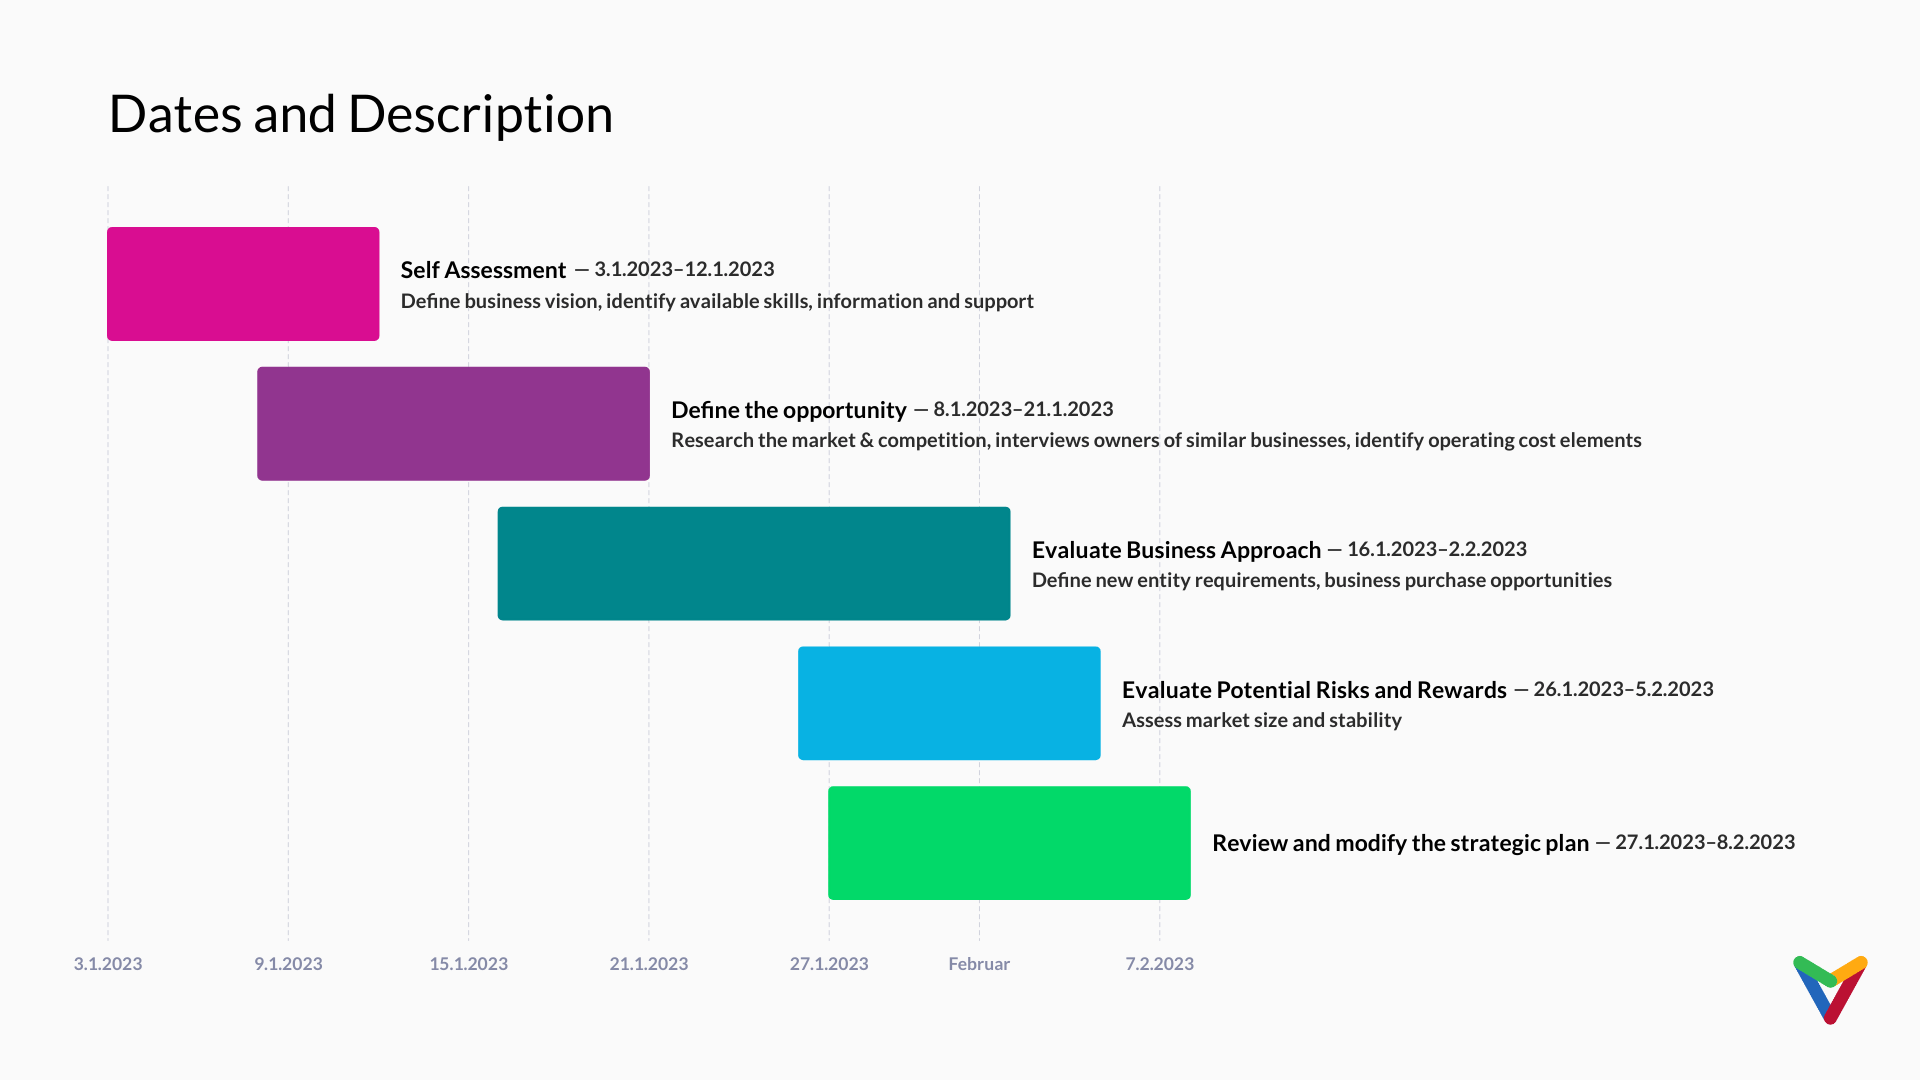
You have four options to show the text and/or dates, which you find under 'Layout settings' in the sidebar:
— show dates and description
— show only dates
— show only description
— don't show dates and description, i.e. only the title is shown.
From the animation above you can see that the width of the segments is dependent on the text content. If the text doesn't fit, it will be displayed on the right side of a segment. The axis adjusts automatically too. There is no way for you to adjust the axis granularity, but instead you can rely on a clever algorithm to do the work for you (this is a Simple Gantt chart intended to make your planning as easy as possible).
Shift all segment into future or past
In the sidebar under 'Data' you can find a date input called Set new starting date. The input element displays the start date of your data by default. When you change this starting date, all your segments will be shifted in time. This comes in handy when you want to use your chart again for another project with a similar project structure.
Change font properties
Besides the text itself, you can also change its properties like color and size. Title and description support rich-text formatting. Highlight the text you want to format and start editing. You can change the font size, the font color, font background color and font style character by character, add bullet points and adjust the text alignment, etc.
Comments
0 comments
Article is closed for comments.