Welcome to Vizzlo! In this 5 minute introduction we will show you the most important steps to get started. If you are using our desktop app, make sure to read our introduction to Vizzlo's Desktop app too. Vizzlo offers you a selection of +100 business charts and graphics; to find the chart you are looking for go to our portfolio at vizzlo.com/graphs.
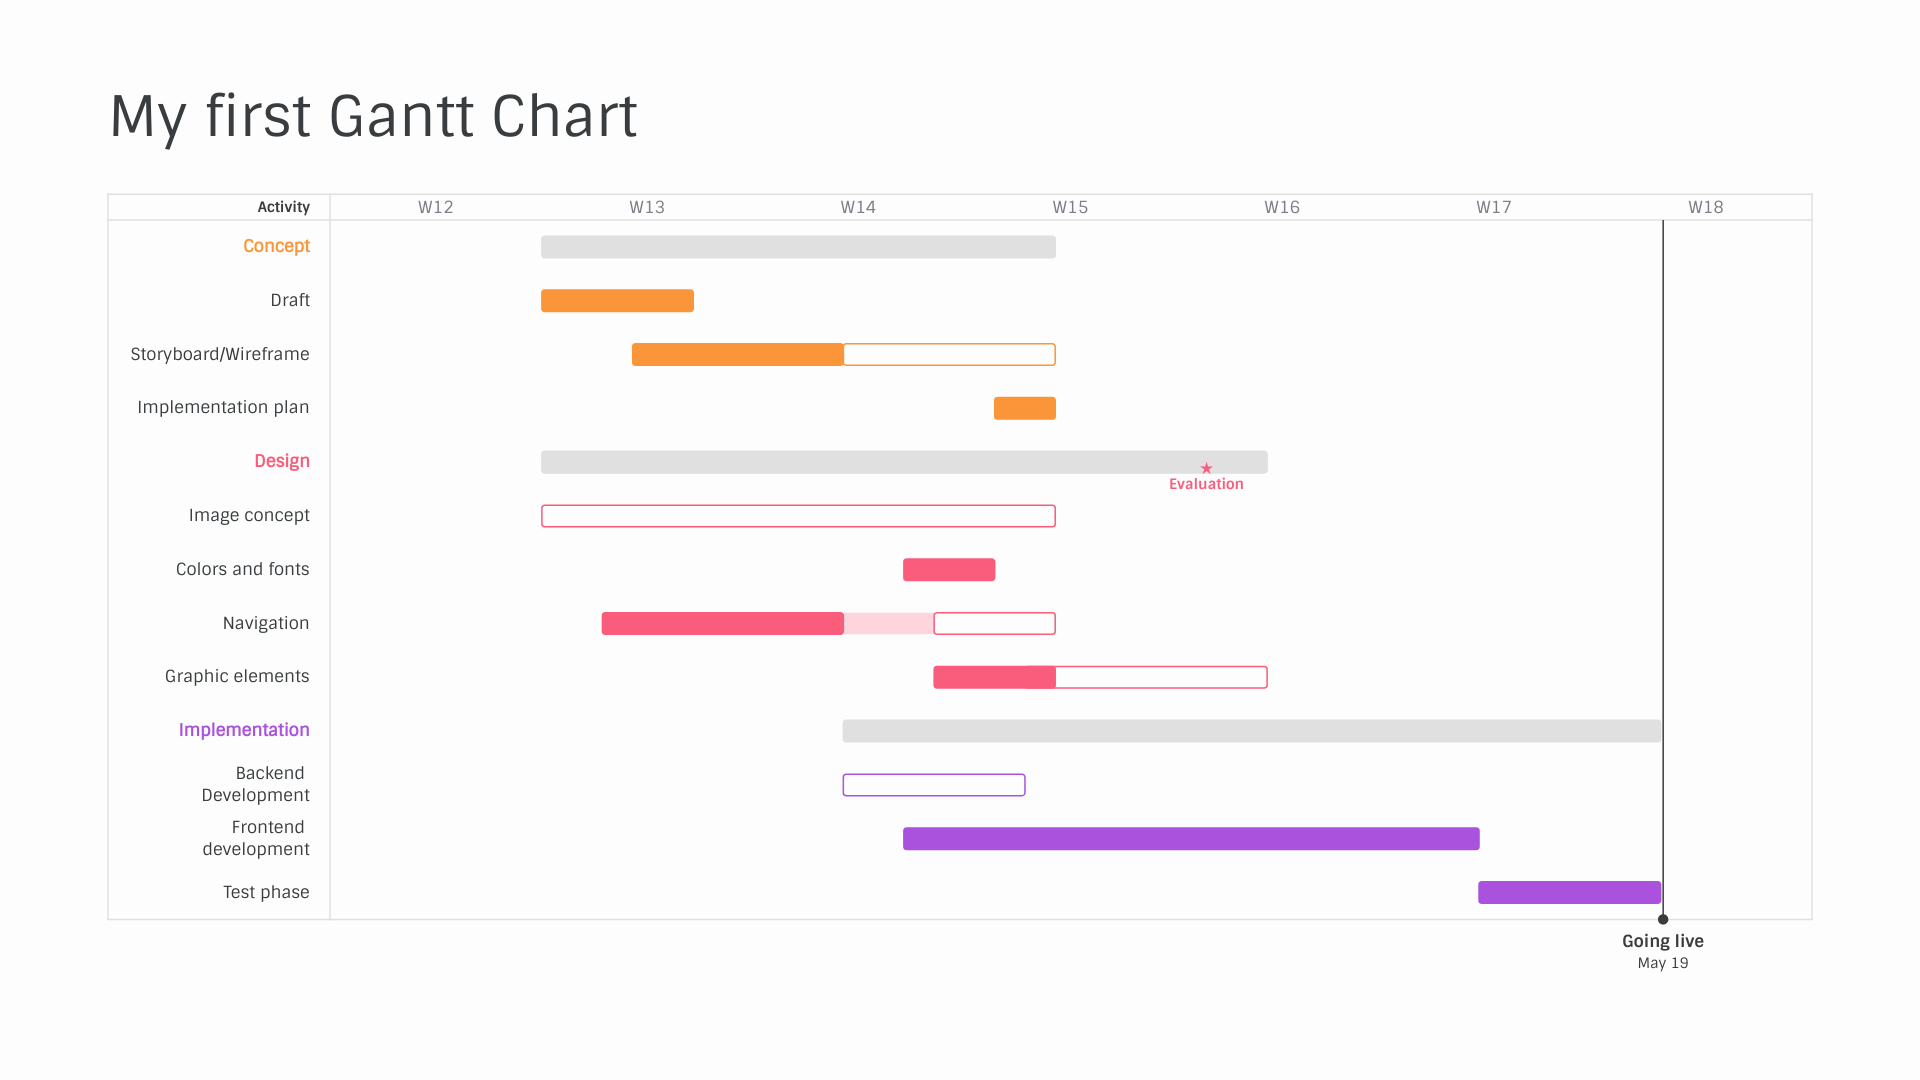
At the end of this tutorial you will have created your first Gantt Chart, a tool widely used among perfect for knowledge workers, marketers, IT professionals, and project managers.
Adding data
Every chart comes with default data. There are multiple ways to add, delete or edit a chart's data. You can either click on one of the elements and change the data in the sidebar, or edit it in the Spreadsheet. Open the Spreadsheet then click on Import data to browse your local files, or simply drag a Microsoft Excel file or CSV file into the spreadsheet. Columns of your data must match the pattern, we take care of parsing dates and numbers for you. You can download the data used for this tutorial here.
After a right click, adding Activities, Segments or Milestones is also possible.
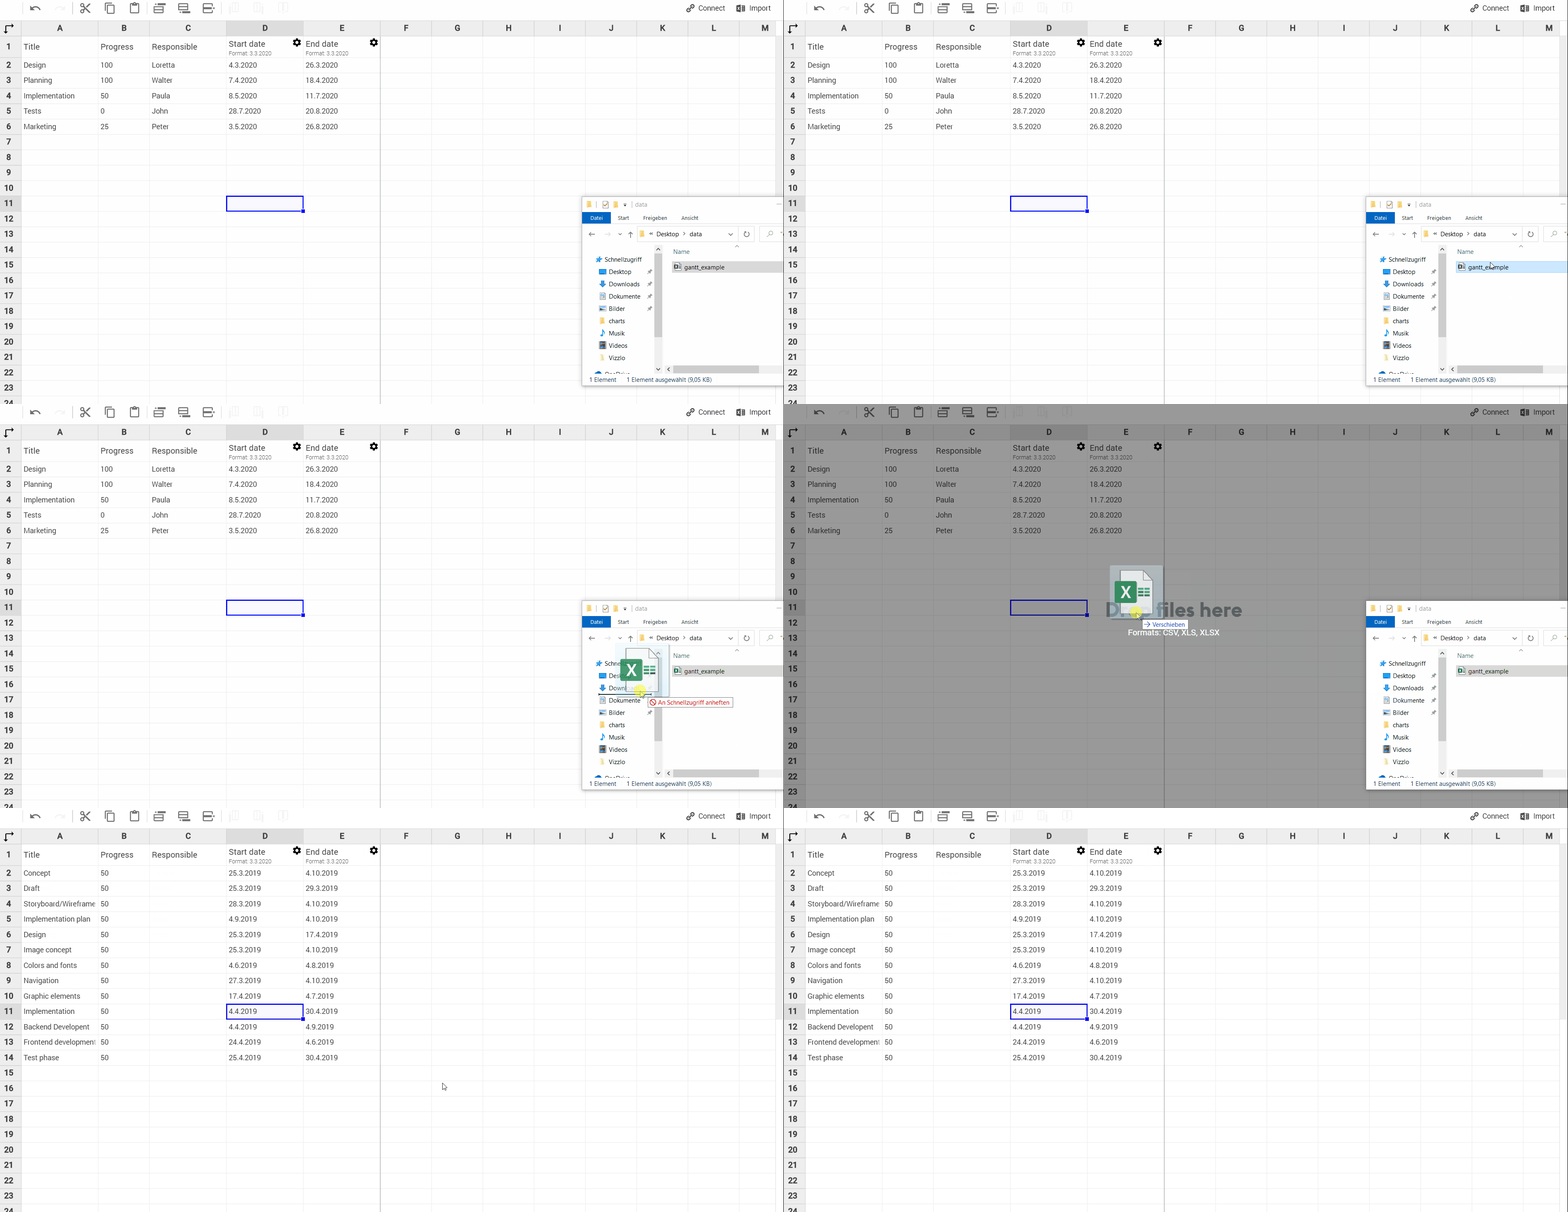
When you have imported the data, your Gantt Chart should look like this: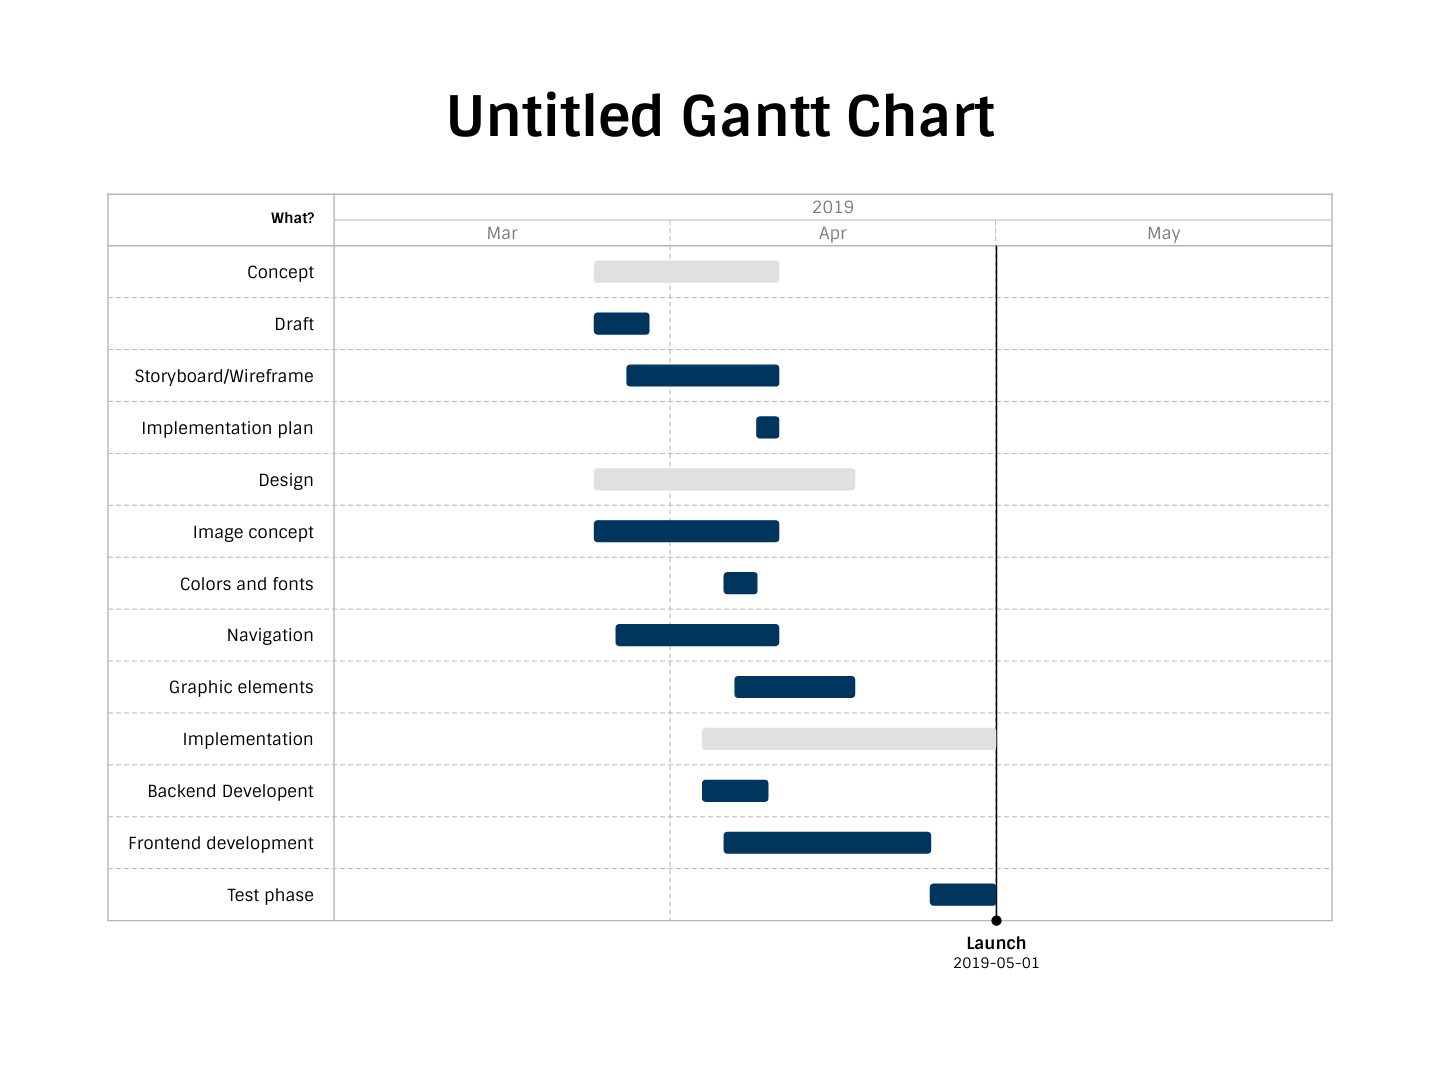
The sidebar
In the sidebar you can change a document theme, layout, properties and label and value formatting. For example, under Layout settings uncheck the options Dependencies, Show progress (Harvey Balls), or click on the eye next to the text input called Column “responsible” to hide the respective elements from your Gantt chart.
Click on the document title to edit it, in the sidebar set the option Axis granularites to Week and now we only need to tweak the document's theme for the final styling.
Theme editor
The overall look of a document can be edited by the settings in the theme editor, i.e. fonts, colors, line width etc. Click on the Customize theme button
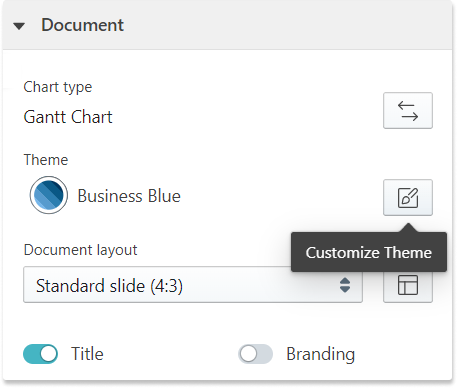
Tip: Read our article 'Customize a theme' for more information.
We create a theme with three colors to distinguish the segments: #FA9639, #FA5D7C, and #AA52DE. As background color we use #FDFDFD, Neutral background color and Accent color are set to #E0E0E0.
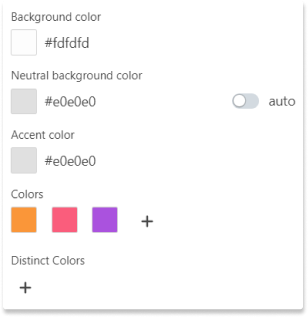
We used Sintony as font type for title, heading, and content.
Editing elements
Editing an element is straightforward - select it with a click and start editing. Change the properties of an element in the sidebar. However, you can drag segments vertically, activities can be drag horizontally too.
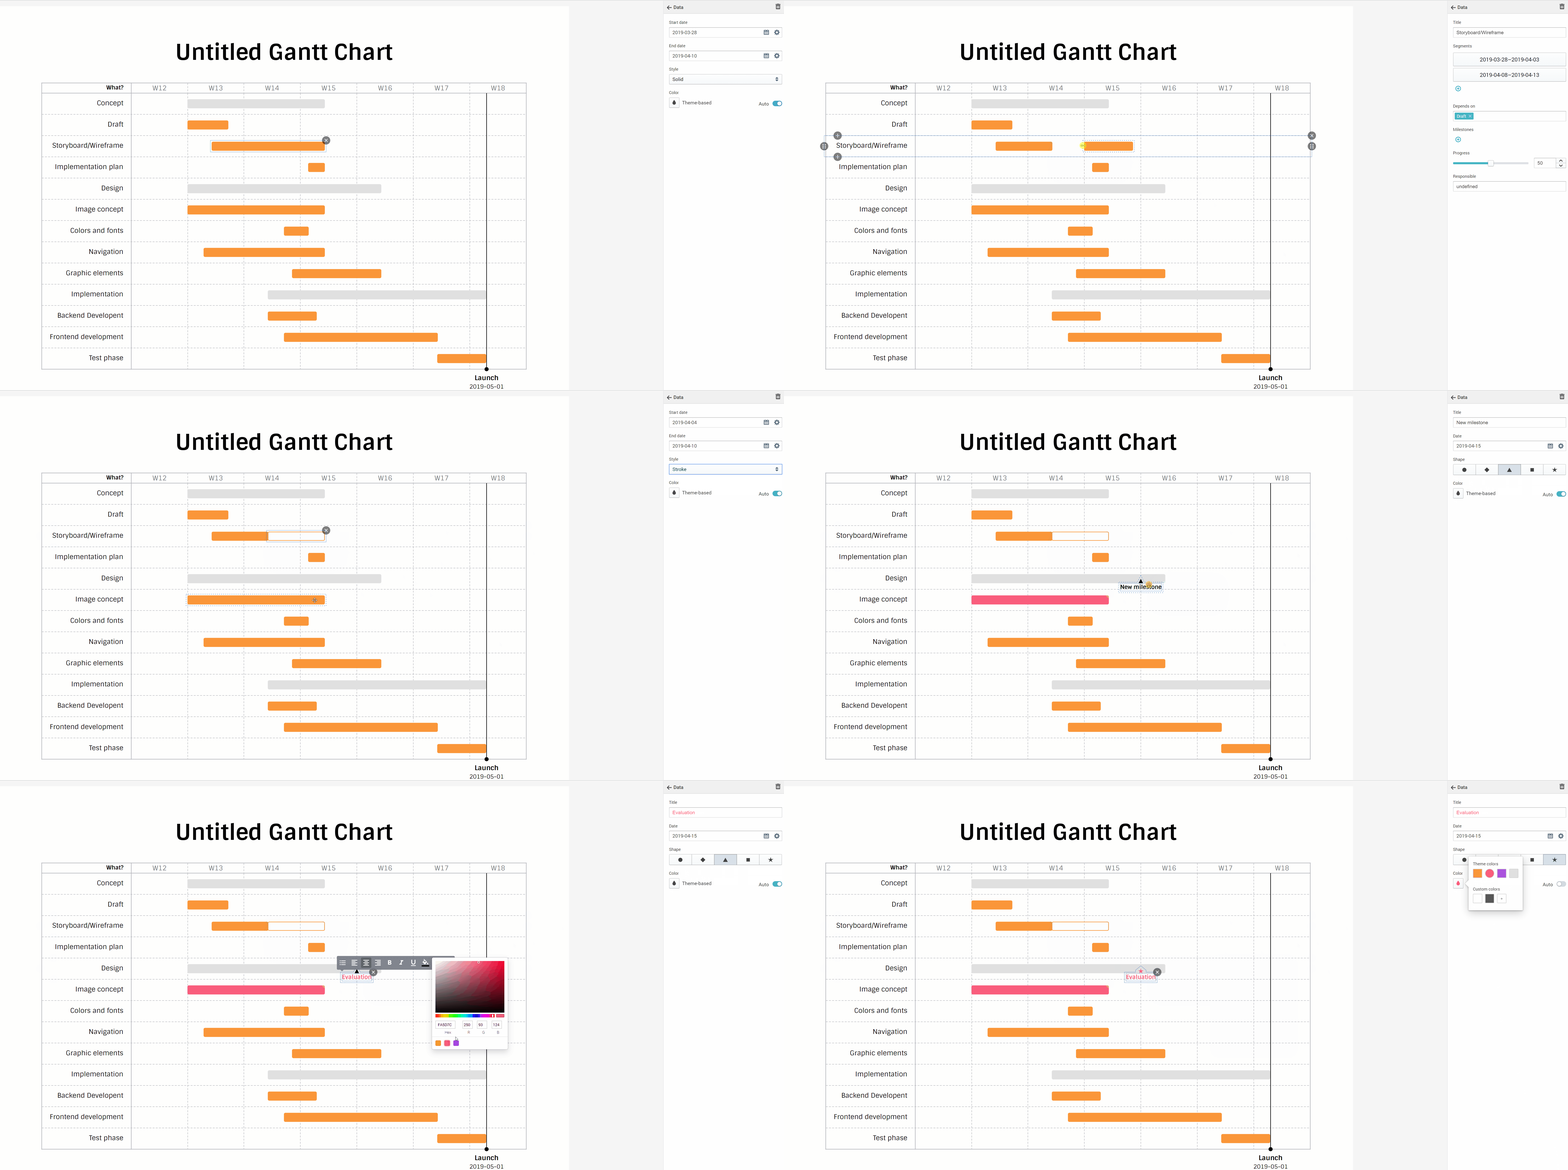
If you are new to Vizzlo we added the final chart to your dashboard. But it can also be downloaded here.

Comments
0 comments
Article is closed for comments.